Training Reporting
Table of Contents:
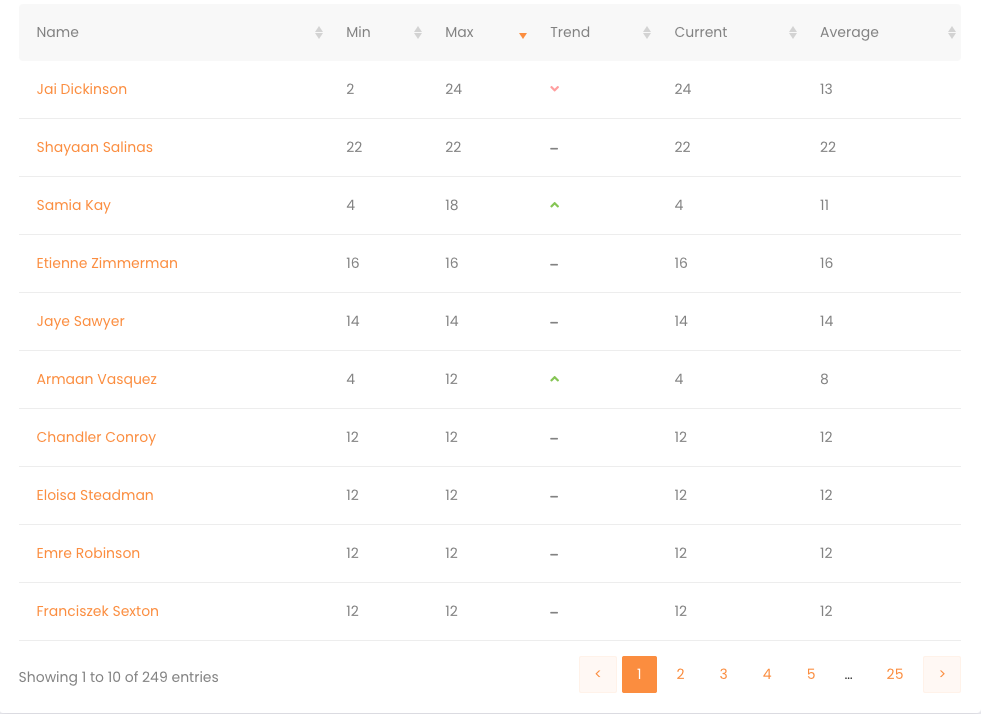
Risk Scores:
The Risk Score table allows for filtering of Learners' Risk Scores to quickly identify Learners who may require additional training.
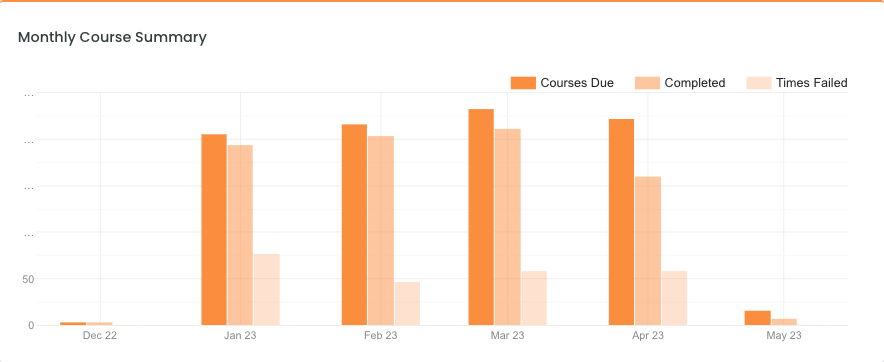
Monthly Course Summary:
The monthly course summary provides a breakdown of how many courses are due for enrolled learners, the amount completed and the failure rate. This graph allows businesses to quickly identify employee engagement trends.
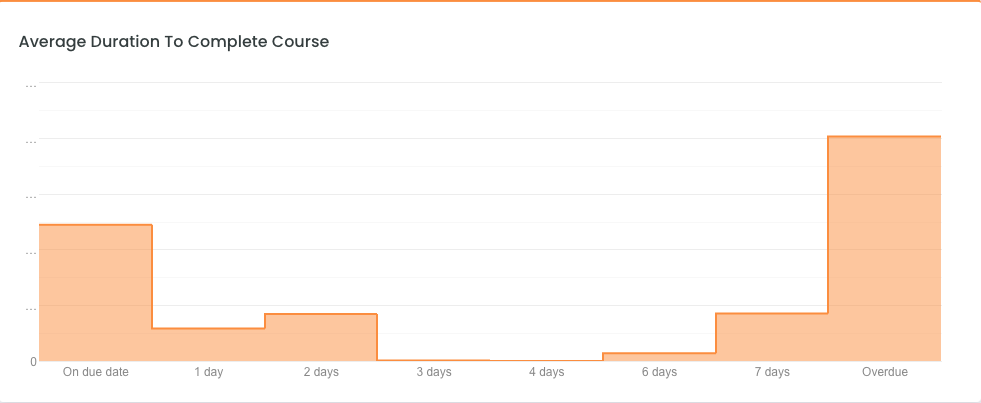
Average Duration To Complete Course:
The following graph provides information on the average time a learner actions their enrolled courses. Trends that show employees completing courses past their due dates, can be an indicator that staff may not be taking training seriously enough.
Leaderboards:
To enhance engagement, the platform incorporates gamification to drive competitive spirits and help build a culture of employees discussing the awareness training.

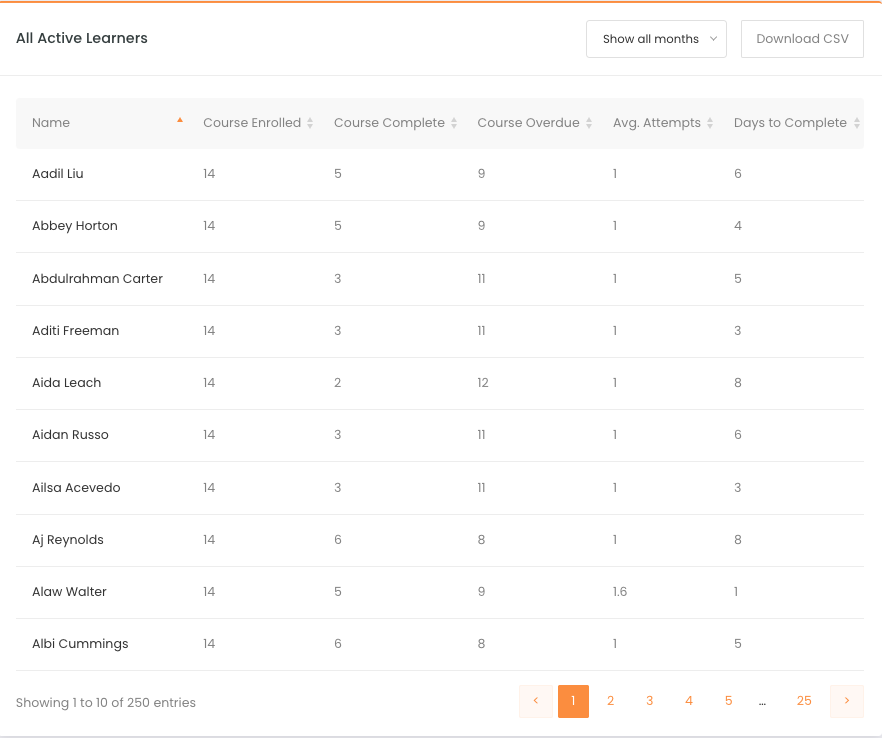
All Active Learners:
The below table is a comprehensive report of a Learners progression through their training journey. It allows for filtering by Courses Overdue, Enrolled, Completed, ect which is often needed for compliance.
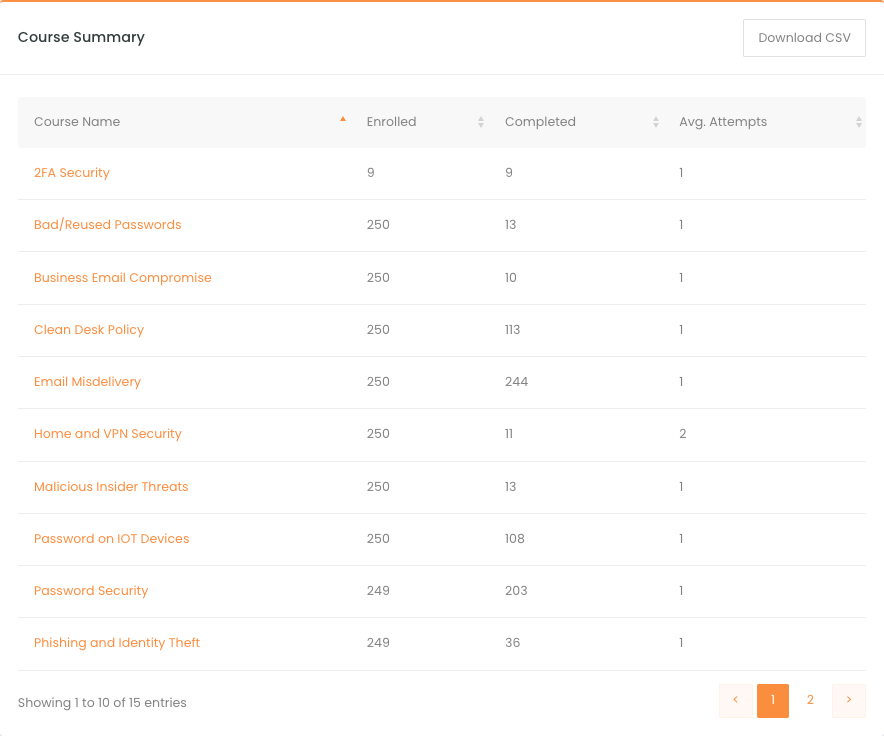
Course Summary:
The Course Summary provides a comprehensive view of the training material enrolled and completed. A useful tool to help businesses to understand what knowledge Learners have as well as to understand what Learners still have left to complete.